FWISD school closures: What’s the campus data behind the closure proposals?
READ MORE
Fort Worth ISD school closures
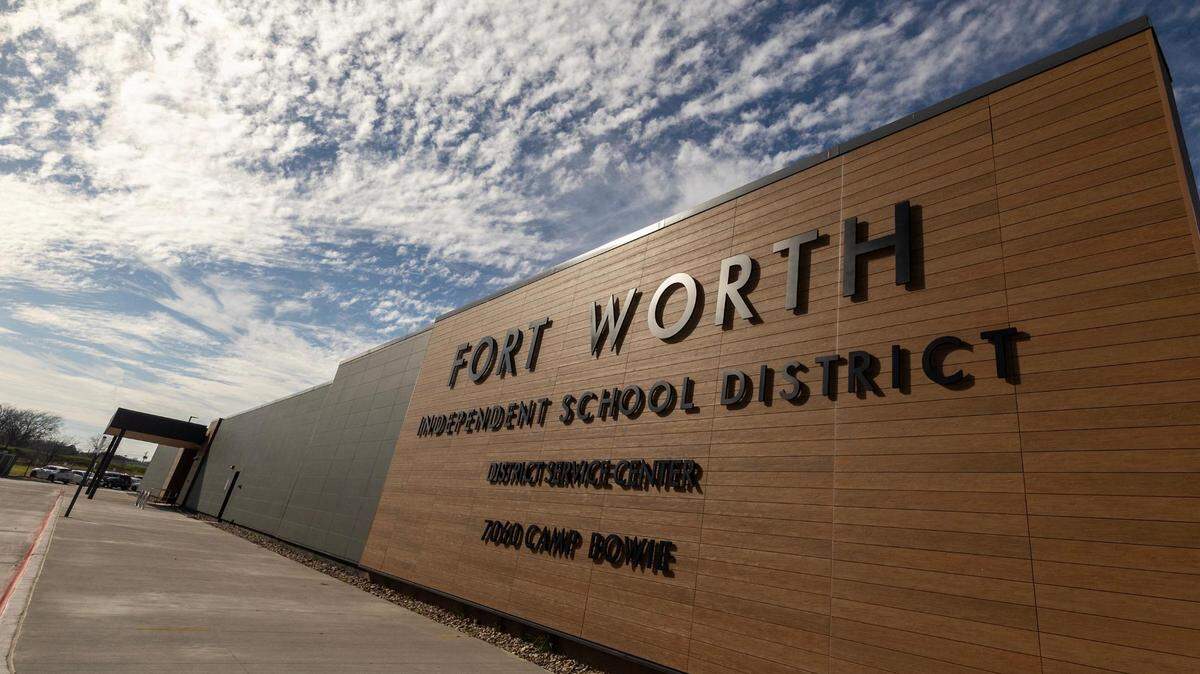
Officials in the Fort Worth Independent School District say that closing and consolidating more than a dozen campuses will save the district millions of dollars over the next four years, allowing them to redirect more money toward academic priorities.
Here’s what to know.
Expand All
The Fort Worth Independent School District school board is on the cusp of approving school closures for a total of 18 campuses after a lengthy process of analyzing facilities and student enrollment. A report with several data points has largely shaped the closure proposals that board members will vote on next week.
HPM, the district’s consulting firm for its facilities master plan, released a State of the Schools Facilities Report in October that outlines Fort Worth ISD’s projected enrollment, capacity, and utilization and educational adequacy of its buildings. It also provides other information about each campus in the district, broken down by pyramids. Among the notable measurements within the report is the educational adequacy score, which shows the current ability of a building to effectively support Fort Worth ISD’s educational standards. A perfect score is 100%.
Fort Worth ISD’s school buildings are growing old, with some falling into disrepair. The average age of the district’s elementary schools, which are predominantly impacted by the proposed closures, is about 62 years old, according to the consultant’s report.
Many schools are also being underutilized as a result of declining enrollment seen over roughly a decade. In pre-K through fifth grade, districtwide enrollment is estimated to decline from 34,094 in the current school year to 32,563 in the 2028-29 school year: a 4.5% decrease.
There are 14 campuses being proposed for closure over the course of the next four school years, in addition to four that have already been approved for closure or consolidation. The board will consider the proposals at its meeting at 5:30 p.m on Tuesday, May 20.
Here are the age, enrollment, capacity utilization percentage, and educational adequacy score of each school being considered for closure, according to the consultant’s report. Each campus’ 2024 A-F accountability score, as calculated by Fort Worth ISD, is also shown to give insight on its academic performance (The scores typically released by the Texas Education Agency are tied up in a pending lawsuit).
A.M. Pate Elementary
Year built: 1958
2024-25 enrollment: 223
2024-25 utilization: 39.8%
Educational adequacy score: 78.6%
2024 A-F accountability score: C
Atwood McDonald Elementary
Year built: 1967
2024-25 enrollment: 259
2024-25 utilization: 42.7%
Educational adequacy score: 78.4%
2024 A-F accountability score: C
Charles Nash Elementary
Year built: 1927
2024-25 enrollment: 222
2024-25 utilization: 84.4%
Educational adequacy score: 51.8%
2024 A-F accountability score: B
De Zavala Elementary
Year built: 1914
2024-25 enrollment: 272
2024-25 utilization: 50.7%
Educational adequacy score: 70.6%
2024 A-F accountability score: A
Edward J. Briscoe Elementary
Year built: 1988
2024-25 enrollment: 265
2024-25 utilization: 47.3%
Educational adequacy score: 77.9%
2024 A-F accountability score: F
Harlean Beal Elementary
Year built: 1948
2024-25 enrollment: 323
2024-25 utilization: 55.4%
Educational adequacy score: 82.1%
2024 A-F accountability score: C
Hubbard Heights Elementary
Year built: 1922
2024-25 enrollment: 509
2024-25 utilization: 75.5%
Educational adequacy score: 80.4%
2024 A-F accountability score: F
H.V. Helbing Elementary
Year built: 1947
2024-25 enrollment: 369
2024-25 utilization: 63.3%
Educational adequacy score: 75.9%
2024 A-F accountability score: D
J.T. Stevens Elementary
Year built: 1967
2024-25 enrollment: 363
2024-25 utilization: 70.6%
Educational adequacy score: 79.9%
2024 A-F accountability score: F
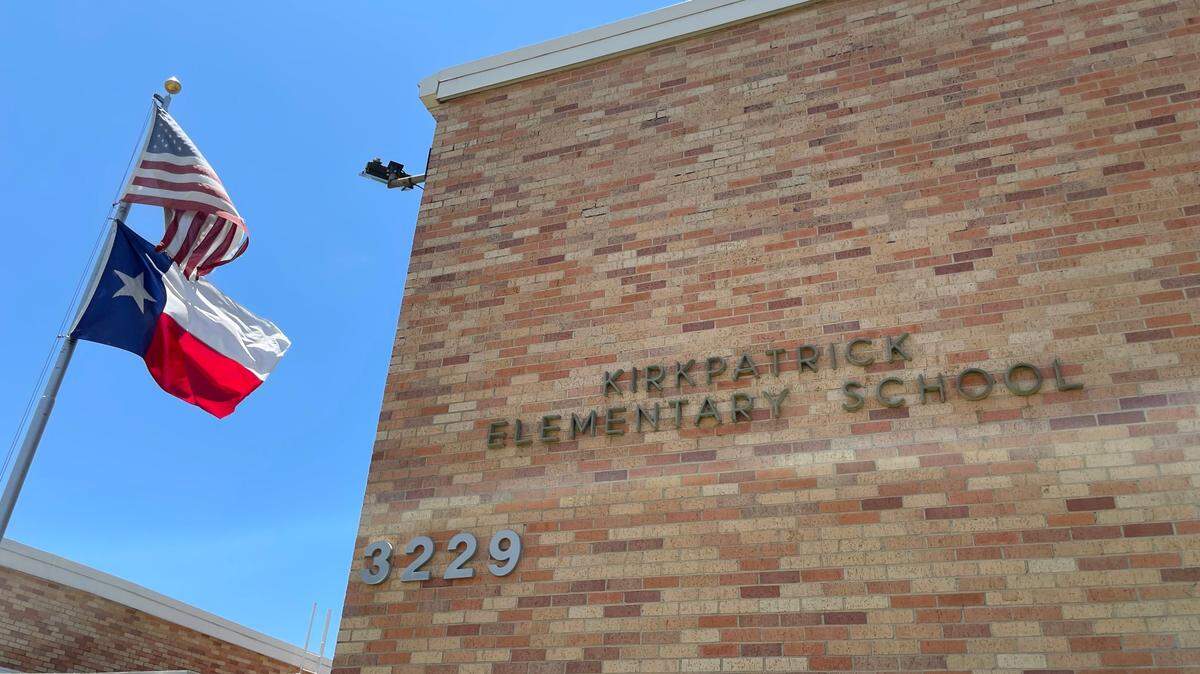
Milton L. Kirkpatrick Elementary
Year built: 1958
2025-25 enrollment: 293
2024-25 utilization: 88.3%
Educational adequacy score: 67.4%
2024 A-F accountability score: D
Sunrise-McMillan Elementary
Year built: 1953
2024-25 enrollment: 414
2024-25 utilization: 77.1%
Educational adequacy score: 73%
2024 A-F accountability score: D
Kirkpatrick Middle
Year built: 1949
2024-25 enrollment: 484
2024-25 utilization: 74.3%
Educational adequacy score: 43.8%
2024 A-F accountability score: D
Morningside Middle
Year built: 1954
2024-25 enrollment: 415
2024-25 utilization: 50.7%
Educational adequacy score: 68.1%
2024 A-F accountability score: F
Riverside Applied Learning Center
Year built: 1950
2023-24 enrollment: 215
Utilization: N/A
Educational adequacy score: The report does not show an educational adequacy score for this campus. It does show a facility condition index percentage of 9.9%, which is a “fair” rating. The measurement reflects the overall health of a facility and is calculated by dividing repair costs with theoretical replacement costs. The campus’ condition is projected to worsen over time with a “poor” rating in five years and a “critical” rating in 10 years.
2024 A-F accountability score: B
Campuses already approved for closure
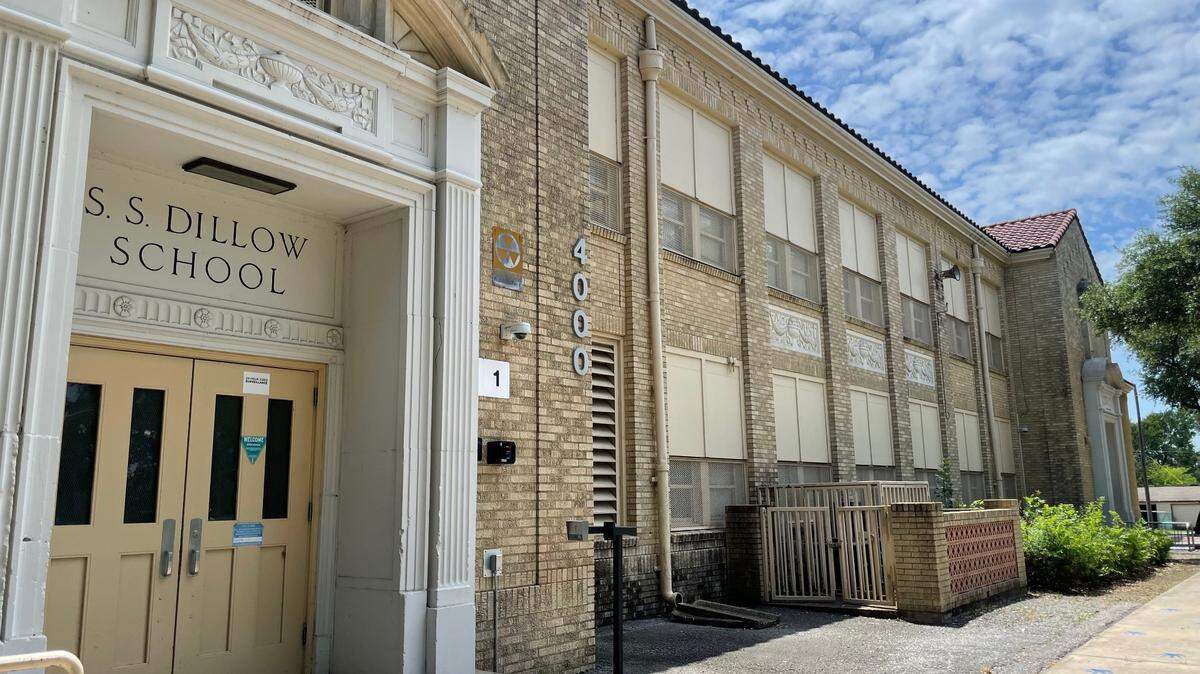
S.S. Dillow Elementary
Year built: 1937
2024-25 enrollment: 430
2024-25 utilization: 68.4%
Educational adequacy score: 79.5%
2024 A-F accountability score: C
Eastern Hills Elementary (will be rebuilt with 2021 bond funding)
Year built: 1958
2024-25 enrollment: 446
2024-25 utilization: 56.5%
Educational adequacy score: 69%
2024 A-F accountability score: F
West Handley Elementary (will be consolidated into the newly built Eastern Hills Elementary)
Year built: 1954
2024-25 enrollment: 345
2024-25 utilization: 54.8%
Educational adequacy score: 77.5%
2024 A-F accountability score: D
McLean Sixth Grade Center
Year built: 1948
2024-25 enrollment: 388
2024-25 utilization: 73.9%
Educational adequacy score: 29.6%
2024 A-F accountability score: B
This story was originally published May 15, 2025 at 2:11 PM.

.JPG)