
Has recent rainfall helped North Texas water levels? This interactive map has answers
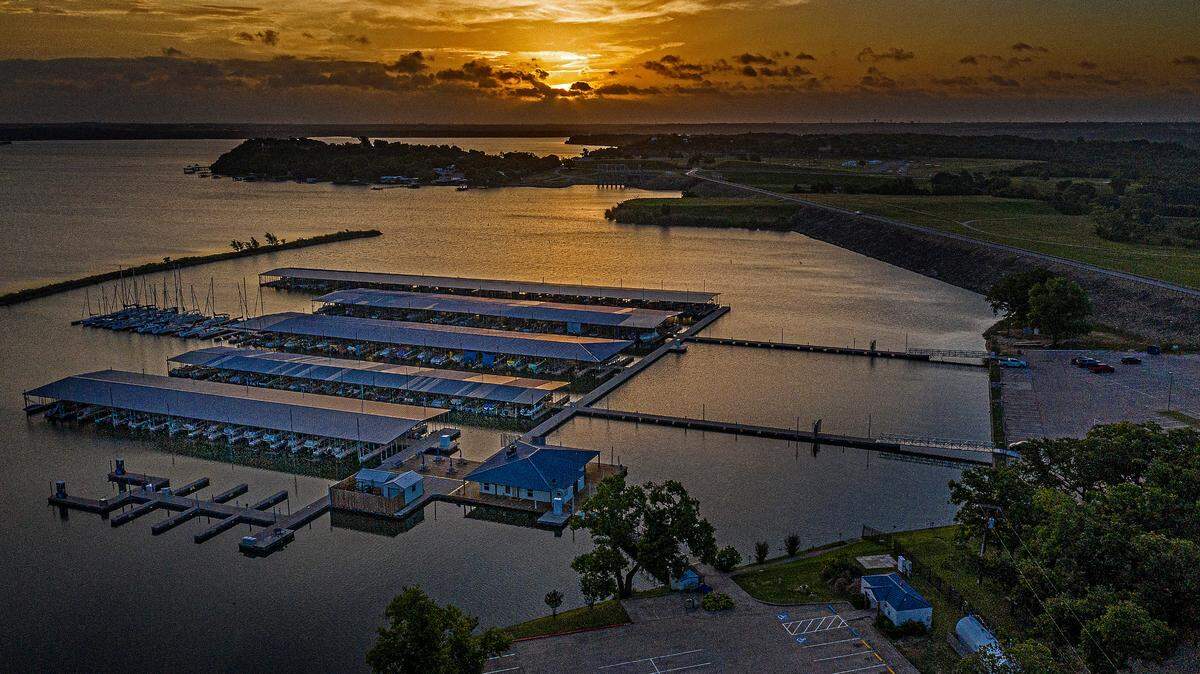
Nearly 5 inches of rain has fallen on parts of Central and North Texas in the past week. The region also got a dusting of snow just over a week ago. Just before Christmas, Dallas-Fort Worth had nearly 2 inches of rain.
So, what does this mean for our water levels?
North Texas water resources have definitely benefited from all the precipitation. But is it enough to allay the fears many have about the drought’s impact on local water levels?
Water is a critical resource in North Texas — from sustaining the farming industry to quenching the thirst of nearly a million people in Fort Worth.
If Texas continues to see record heat in the summer months, farmers worry drought levels will worsen, depleting water wells across the state. In July 2022, 97% of Texas was in a drought, affecting 24.1 million Texans, per the U.S. Drought Monitor. As the heat persists, drought conditions in the state are only going to get worse.
With more people moving to Fort Worth, the demand for water will grow with the population. Between 2010 and 2021, the City of Fort Worth grew by 25%, adding more than 194,000 residents. By 2028, there will be more than a million people living in the city, according to the U.S. Census data.
To help residents, old and new, keep track of our water, the Star-Telegram has developed an interactive map that shows in real-time the levels of our watersheds and nearby reservoirs. It also shows drought levels in our region and areas across Texas.
This story was originally published January 25, 2024 at 2:06 PM with the headline "Has recent rainfall helped North Texas water levels? This interactive map has answers."